Don't waste your time learning a new technology or framework because it's shiny and new. It will be replaced by the next thing that comes along, and you will start from scratch. Instead, invest in learning fundamentals and concepts. They already stood the test of time. If something is used for 10 years it is likely it will be useful for another 10. Statecharts are one such thing. They helped me fix a nasty bug in a distributed event sourced system. If you are familiar with state machines you can think of statecharts as state machines on steroids. In essence, they visualize your software in a certain way. This allows you to reason, debug and think about your system without looking at source code. You can even integrate them directly in your project, but that is only the icing on the cake.
Let me give you context before we look at the bug. The system in question is an online darts tracker. It allows people to play darts against each other from their home instead of meeting up in a pub. Each game of darts is stored as a sequence of events. An event is something that happened. EnteredDart and TurnHandedOverToNextPlayer are two examples. The exact state of the game is reconstructed by looping over all events. This concept is known as Event Sourcing.
To make the playing experience as smooth as possible the logic is run directly client-side. The distributed clients synchronize with each other via a central server. When a player does something in the game the client generates new events. At this point the local event history differs from the remote history on the server. To synchronize it makes an HTTP request to append the new events to the server's event history.
This part of the system is called Appender. It looks and works like this.
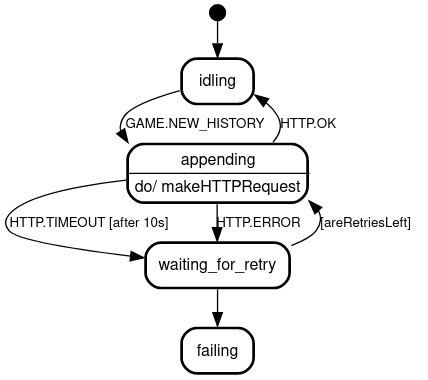
Don't worry if the image confuses you. The bubbles are the states the Appender can be in. The arrows tell you how it transitions from one state to another. Let's focus on the state idling. When the Appender is in this state and receives GAME.NEW_HISTORY it transitions to appending. There it makes the HTTP request to append the new local history. As soon as the HTTP request succeeds with HTTP.OK it transitions back to idling where it waits for a new history.
The nasty bug I mentioned at the start is connected with appending new events to the remote history on the server. A player got an error message that the client was unable to append its local history because the server's history was not what it expected. Each HTTP request includes an expected version in the payload along the actual events. This prevents the server from overwriting and losing someone else's history in case there is a bug in the game logic.
But that was not the case. The problem was the Appender itself. Looking at the statechart you can see there is a transition from appending to waiting_for_retry due to HTTP.TIMEOUT after 10 seconds. I added this to protect against slow HTTP requests. My reasoning was that after 10 seconds the Appender should just try again for a few times. I did not realize that an HTTP request could successfully reach the server but then take a long time to return the response.
That is exactly what happened. For some reason one of the many HTTP requests took 24 seconds to receive the response instead of mere milliseconds. After 10 seconds the Appender triggered HTTP.TIMEOUT and tried to append again. But the server already received the new history and returned an error indicating a version conflict.
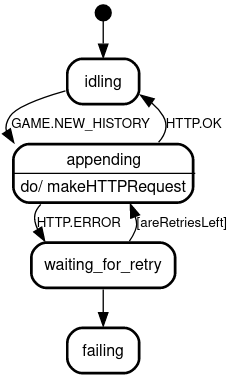
The bug is easily fixed by removing the HTTP.TIMEOUT after 10 seconds.
Slow responses no longer crash the client because no HTTP.TIMEOUT is happening. But slow responses are still occurring. It would be nice to show the player a notice that synchronizing is slow. Adding this feature demonstrates perfectly the value of statecharts. By turning appending into a parallel state we can do two independent things. The substate http.appending appends the events with the known HTTP request. The other substate contains a 10 second timeout. But compared to the initial version this timeout does not cancel the HTTP request. Instead, it transitions from monitor.waiting_on_success to monitor.waiting_on_success_with_notice. Whenever the statechart is in monitor.waiting_on_success_with_notice it makes the UI show a notice regarding the slow synchronization. As soon as the HTTP request succeeds the http.appending state is left and the UI will no longer show the notice.
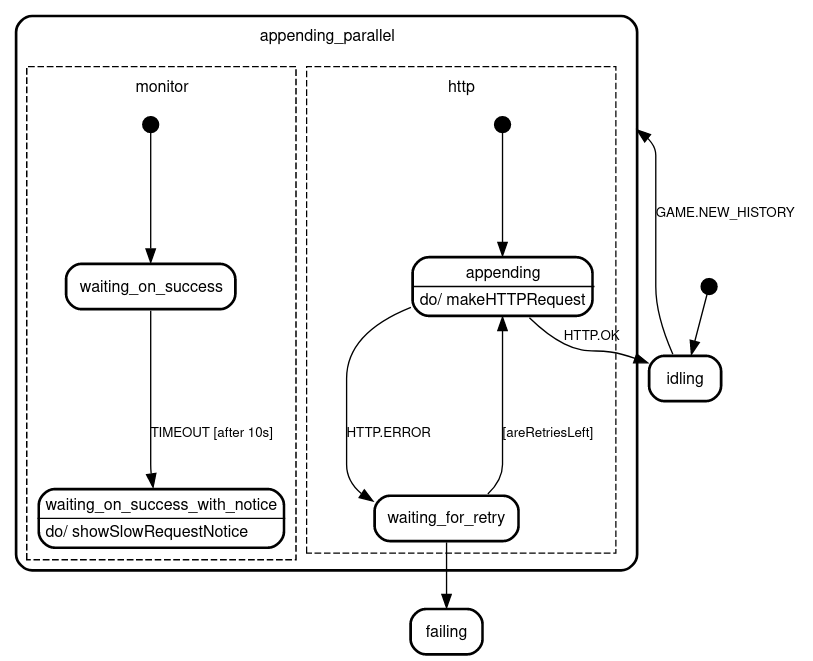
This image looks very different from the previous ones. You might think this would mean a near rewrite of the logic. But that is not the case and demonstrates the power of statecharts. They allow you to make significant changes to your system while limiting the amount of source code that needs to be touched.
If you want to learn more about statecharts I highly recommend https://statecharts.dev. For TypeScript and JavaScript projects XState is the best library to integrate statecharts directly into the source code.